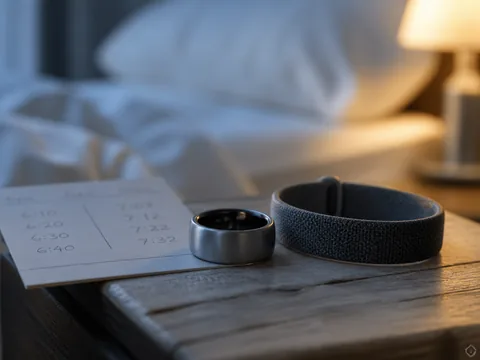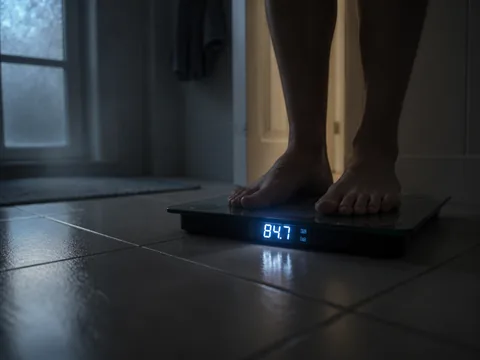
There is a particular kind of disappointment that happens on a bathroom scale at 6:40 in the morning. Not the weight — the other number. The body-fat percentage that appeared underneath it, which last Tuesday said 19.4% and this Tuesday says 22.1%, and you have not, in seven days, done anything that would move three points of body fat.
So the question, and it's the one this piece spends its length on: is that number measuring your body, or is it measuring how much water you were carrying when you stepped on? I spent two weeks putting AI health technology — the camera-and-model approach that estimates body composition from photographs — up against the impedance sensors already in my scale and on my wrist, because the interesting comparison isn't which one wins. It's what the comparison reveals about the thing we've all been trusting.
The verdict, up front: impedance-based body composition is precise but not accurate. It will give you nearly the same number twice in a row under identical conditions, and a wildly different number if you change one variable that has nothing to do with fat. Photo-based estimation is roughly as good at the same task — which is less a compliment to the camera than an indictment of the baseline.
What the current is actually doing
Impedance measurement works by pushing a small alternating current — typically 50 kHz, in the range of 500 to 800 microamps — from one contact point to another and measuring what the body does to it. Fat-free mass is about 73% water and full of electrolytes, so it conducts. Adipose tissue and bone don't, much. The device measures resistance, sometimes reactance, and then hands those figures to a regression equation that also takes your height, weight, age, and sex.
That last part is the part nobody mentions. The device is not seeing your fat. It is measuring the electrical resistance of your body, then consulting a statistical model built from a population — one that may or may not resemble you — to guess what proportion of you is fat. Two people with identical resistance readings and different ancestries can get different outputs, because different equations were fitted to different reference groups.
And the input to that equation is dominated by water. Your total body water on a given morning is a moving target: sodium the night before, glycogen stores, menstrual cycle phase, how much you sweated, skin temperature, and — the one that made this a JavaSleep story — how much coffee you've had.
The setup
Fourteen consecutive days, four sources, one body. Mine: 41 years old, 178 cm, roughly 76 kg across the test, three strength sessions and two runs a week.
- Foot-to-foot scale (Withings Body Comp, $199): four electrodes, current travels up one leg and down the other. Measured every morning at 06:30, barefoot, fasted, after voiding, before any liquid.
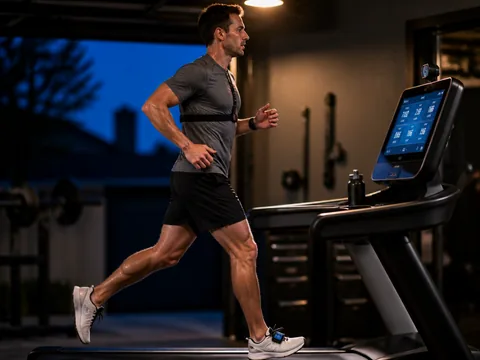
- Wrist wearable (Galaxy Watch, two-electrode arm-to-arm with the finger on the crown): same time, same conditions, immediately after the scale.
- Hand-held segmental unit (Omron HBF-514C, $89): eight electrodes, hands and feet, so current passes through the torso rather than around it.
- Photo estimation: four standardized photos — front, back, both profiles — same corner of the same room, same lamp on, same distance marked on the floor, processed through a consumer body-composition app.
On seven of the fourteen days I measured under those fixed conditions. On the other seven I broke one condition on purpose: measured at 6 p.m. instead of dawn, or after 500 ml of water, or after a training session, or after two cups of coffee and nothing else.
What came back
| Source | Fixed-condition range | All-condition range | Widest single-day swing |
|---|---|---|---|
| Foot-to-foot scale | 19.1–20.3% | 17.8–22.6% | 3.4 points |
| Wrist wearable | 17.6–19.4% | 15.9–21.8% | 4.1 points |
| Segmental hand-to-foot | 21.2–22.0% | 20.4–23.5% | 2.2 points |
| Photo estimation | 20.8–21.6% | 20.6–21.9% | 0.9 points |
Read the first column and the impedance devices look respectable. A 1.2-point band over a week is fine for tracking. Read the second column and the illusion collapses: the same body, the same fortnight, and the wrist sensor spanned nearly six points depending on what time I stood up.
The segmental unit was the steadiest of the three impedance methods, which makes sense — routing current through the torso rather than looping it up one leg and down the other captures more of the body and depends less on leg hydration alone. It also read consistently 2–3 points higher than the scale. Both cannot be right. Neither may be.
The photo estimate barely moved, and that deserves a caveat rather than applause: a model working from silhouette and shading has nothing to respond to when your hydration shifts. Its stability is partly a virtue and partly a failure to notice anything at all. But since the thing it isn't noticing is noise, the stability is useful.

The coffee test
This is where the JavaSleep angle stops being a stretch. Caffeine is a mild acute diuretic in people who aren't habituated to it, and it also raises peripheral skin temperature and blood flow — both of which change tissue conductivity independently of any fluid loss.
On three separate mornings I measured fasted at 06:30, then drank two cups of drip coffee (roughly 190 mg of caffeine total, measured against a 12 g dose per 200 ml cup), then measured again at 07:45 with nothing else consumed.
The scale's reading rose by an average of 1.6 percentage points of body fat across the three trials. The wrist wearable rose 2.2. Total mass had fallen slightly. I had not, in seventy-five minutes, gained fat; I had lost a small amount of conductive fluid and warmed my hands, and the regression equation interpreted both as adipose tissue.
The photo estimate over the same intervals moved 0.1, 0.0, and 0.2 points — noise in the model, not a signal about me.
If you drink coffee before you weigh yourself and your friend doesn't, you are running different experiments and comparing the results.
Where the answer becomes 'it depends'
If you want a trend, impedance is fine — under a protocol you never break. Same device, same hour, fasted, pre-coffee, post-void, same hydration habit the night before. Under those conditions my scale held a 1.2-point band across a week, which is tight enough to see a real six-week change. The precision is real. It's the accuracy that's fictional.
If you want an absolute number, none of these gives you one. Not the scale, not the watch, not the camera. Reference-standard imaging exists and costs $75–150 a session, and I didn't get one, which means I can tell you these four methods disagree with each other but not which of them is closest to true. That's a genuine hole in this piece and I'm not going to paper over it.
If you're choosing between ecosystems on this feature alone, don't. The Pixel-versus-Samsung framing that surrounds camera-based estimation makes it sound like a decisive spec-sheet win. In practice one approach measures water and calls it fat, the other measures shape and calls it fat. Neither is looking at fat. The wearable has the advantage of measuring without you doing anything; the camera has the advantage of not caring what you drank. Those are different failure modes, not a ranking.
The thing camera-based methods genuinely can't do: distinguish visceral from subcutaneous fat with any confidence, or catch a change hidden under clothing-adjacent posture differences. Impedance at least has a physical relationship — however noisy — to what's inside you. A photograph has a relationship to your outline.
Who this is for, and who it isn't
Worth your money and attention if: you'll commit to a fixed measurement protocol and you care about direction over twelve weeks rather than a number this morning. Then a $90 segmental unit beats a $400 wearable at this specific job, and it isn't close.
Worth it if you're the kind of person who will photograph yourself under standardized conditions once a month — that's the most honest version of consumer body composition tracking available right now, and it costs nothing but discipline.
Not for you if you want a clinically meaningful body-fat percentage. Buy one reference scan a year and use the consumer tools to fill the gap between them.
Definitely not for you if you check the number daily and let it affect your mood. You are riding a hydration curve and mistaking it for progress.
What I couldn't test
One body, fourteen days, no imaging reference, and a photo-estimation app that is a consumer product rather than the research-grade systems currently being written about. My sample is n=1 and my hydration habits are my own. Everything above describes what these four devices did to me; treat the direction as informative and the specific magnitudes as one person's numbers.
What I actually changed
My scale sits in the bathroom and my kettle is nine steps away in the kitchen, and for about four years the order of operations was kettle, then scale, because the water takes three minutes to boil and standing on a scale is something to do while you wait.
I've reversed it. Scale first, in the dark, then the kettle. It costs me nothing and it removed the largest single source of noise in the only number I was tracking.
I've also stopped reading the body-fat figure at all on weekdays. I open the app on Sunday, look at the four-week line, and close it. The daily number was never telling me about my body. It was telling me about my coffee.