The standard advice, the kind you'll get from a support forum or a hurried follow-up call, goes like this: if your CPAP reports an AHI under 5, your therapy is working, and you should stop staring at the nightly number because it bounces around and the bounce means nothing.
That advice is mostly correct. It is also incomplete in ways that matter to exactly the kind of person who reads their machine's app every morning before coffee — which is to say, me, and probably you.
I have moderate obstructive sleep apnea, treated for three years. For 90 consecutive nights I logged my reported AHI along with a short list of variables I could actually control or observe. Here is the verdict up front: a single night's AHI tells you almost nothing, the threshold of 5 is a useful floor but a poor summary, and the number you should actually watch is the shape of the line over two or three weeks — not last night's spike. Everything below is the case for why.
What I actually measured, and what I couldn't
One machine, unchanged, for the whole run: a ResMed AirSense with the same nasal-pillow mask and the same fixed-pressure-range auto setting throughout. Changing the hardware mid-experiment would have made the data meaningless, so I didn't.
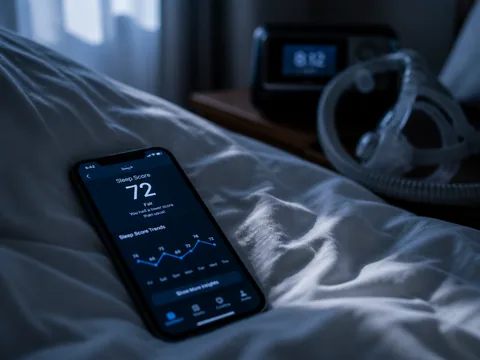
Each morning I recorded, from the app: total AHI, the machine's breakdown into obstructive and central events, mask-leak figures, and usage hours. Then I added things the machine doesn't know: whether I'd had alcohol, roughly when I stopped drinking it, whether I had a cold or congestion, which position I remembered falling asleep in, and how rested I felt on a plain 1-to-5 scale.
Now the honest limits. This is a sample of one. My apnea is positional and mostly obstructive; if yours is central-dominant or severe, my distribution will not be yours. My "position" data is unreliable because I don't know where I spent the night, only where I started. And the biggest limitation is baked into the whole exercise: the AHI on the screen is the machine's estimate of events, not a sleep lab's scored recording. The device is inferring apneas and hypopneas from airflow and pressure. It is good at this. It is not a polysomnogram. I'll come back to that, because it's the crack the standard advice falls through.
Where the advice is right: the noise is real
Over 90 nights my AHI ranged from 0.4 to 6.8. The mean was 2.3. The median was 1.9.
If you'd handed me only the 6.8 night, I would have spent the next day mildly anxious. In context, it's a normal member of a noisy set. Here's the rough distribution:
| Reported AHI | Nights | Share |
|---|---|---|
| Under 1 | 21 | 23% |
| 1 to 3 | 46 | 51% |
| 3 to 5 | 17 | 19% |
| Over 5 | 6 | 7% |
Six nights over the "worrying" line. Not one of them meant my treatment had failed. Two followed a couple of glasses of wine; one came with a head cold; the other three had no explanation I could find, which is the whole point. Biology is not a metronome. Your sleep architecture shifts, you spend more of the night on your back, a stretch of REM does what REM does to airway tone, and the number moves. None of it is a verdict.
So the reassuring part of the standard advice earns its keep. A single high night inside an otherwise low pattern is noise. If you take nothing else from this piece, take that, because it will save you a hundred pointless anxious mornings. The device makers who tell you not to over-read one night are, on this narrow point, right.
Where they lose me is the implication that the number itself is trustworthy just because it's low, and that "under 5" is the same reassurance for everyone. Neither holds.
Where it breaks down, part one: the number is only as honest as the seal
For eight of my 90 nights, the AHI was low and the reading was, functionally, a lie.
Those were nights with a large mask leak. When air escapes past the seal in volume, the machine's ability to detect events degrades. It can under-report, reading a calm 1.5 while airflow data it can actually trust has thinned out. On my best-fit nights, leak sat around 2 to 4 litres per minute above the mask's baseline. On the bad nights it spiked past 24. The AHI on two of those nights was under 2 — and I don't believe those numbers, because the instrument couldn't see clearly enough to earn them.

This is the first place "AHI under 5, you're fine" quietly fails. The threshold assumes the measurement is valid. A low AHI recorded through a hissing, half-detached mask is not the same data point as a low AHI recorded through a good seal, and the top-line number won't distinguish them for you. You have to open the leak graph yourself.
The practical upshot: check leak before you celebrate the AHI, and check it before you panic about it. A high AHI on a high-leak night might be an artifact. A low AHI on a high-leak night might be a mirage. The threshold only means something when the seal held.
Where it breaks down, part two: "under 5" hides what the number is made of
Two of my nights read exactly 4.1. Same top-line number, well under the line, both "fine" by the standard rule. They were not the same night.
One was 4.1 obstructive events per hour — my normal machinery, a slightly rougher version of every other night. The other was 4.1 with an unusual share of central events, the kind where the drive to breathe briefly pauses rather than the airway closing. My centrals are usually near zero. On that night they weren't.
A single night of a few extra centrals is, again, probably noise, and I'm not going to pretend one reading rewired my confidence. But it made the flaw in the threshold obvious. Two identical AHI numbers can describe two different physiological situations, and the composition is the interesting part. Obstructive events say something about your airway and your mask and your position. Central events say something about your respiratory control, and a persistent rise in them — especially emerging on therapy — is the kind of pattern that belongs in front of a sleep physician rather than in a forum thread.
The standard advice collapses all of this into one scalar and one cutoff. That's efficient. It's also why a reader can be technically reassured and still be missing the plot. If your machine breaks the number down — most do, somewhere in the app — the breakdown is worth more than the total.
There's a related trap with position. Because my apnea is positional, my AHI is essentially a report on how much of the night I spent on my back. A "good" night can just mean a night I happened to stay on my side. That's genuinely good — but it tells me about my sleeping position, not about whether my underlying disease changed. The metric mixes those together and hands you one figure.
Where it breaks down, part three: the threshold is the wrong object to watch
Here is the finding that changed how I read the app.
I split the 90 nights into three 30-night blocks and looked at the rolling averages instead of the individual nights:
| Block | Nights | Average AHI | Nights over 5 |
|---|---|---|---|
| 1 (days 1–30) | 30 | 1.8 | 1 |
| 2 (days 31–60) | 30 | 2.1 | 2 |
| 3 (days 61–90) | 30 | 2.9 | 3 |
Every single one of those averages is comfortably under 5. By the standard rule, all three blocks are equally "fine." But look at the direction. My average nearly doubled across the run, and the count of over-5 nights climbed with it.
The cause, once I bothered to find it: a slow, unglamorous decline in mask condition. The cushion had softened over three months of nightly use, the seal had gotten marginally worse, my leaks had crept up, and my events crept up behind them. A fresh cushion in month four pulled the average back toward 2.
The threshold never would have caught this. Nothing crossed 5 as an average. But a stable-then-rising line — even entirely inside the "safe" zone — is a signal that something is changing, and change is the thing worth investigating. The standard advice trains you to watch a horizontal line at 5. The more useful instinct is to watch the slope of your own baseline, wherever it happens to sit.
This cuts both ways, and it's the reassuring half of the same idea. If your average has been quietly sitting at 3 for a year and last night reads 7, the trend is your friend: one number stepped out of line, the line itself is steady, and steady is what matters. The alarm should fire when the line moves, not when a point does.
What actually moved my number
Stripping out the noise, here's what showed a real, repeatable effect across 90 nights, ranked by how much it mattered:
| Factor | Direction | Rough effect |
|---|---|---|
| Mask leak / cushion age | Raises AHI (and corrupts it) | Largest, and sneaky — it drifts |
| Alcohol within ~3 hrs of bed | Raises AHI | Roughly +1.5 to +3 on affected nights |
| Nasal congestion / cold | Raises AHI | +2 to +4, resolves with the cold |
| Sleeping supine | Raises AHI | Real for me, hard to quantify |
| Usage hours | Indirect | More hours meant more REM captured, nudging AHI up on long nights |

That last row is a quiet one worth flagging. A night where I slept nine hours often read slightly higher than a night I slept six — not because the therapy worked less, but because a longer night contains proportionally more REM, and REM is where my events cluster. So a "worse" number can come from a better, longer sleep. The metric doesn't tell you that either.
Alcohol was the most reliable lever I had. On the nights I drank and stopped early, the effect was smaller than the nights I drank close to bed, which is at least a satisfyingly logical result. It relaxes the airway musculature, and my airway obliges. This isn't a moral point about drinking; it's just the clearest input–output relationship in the whole dataset.
Who this rule serves, and who it fails
The standard "under 5, don't overthink it" advice works well for you if: you're newly diagnosed and prone to reading catastrophe into every reading; your apnea is straightforwardly obstructive; your leaks are consistently low; and your line has been flat for months. For you, the reassurance is the correct medicine, and the daily check is probably feeding anxiety more than it's feeding insight. Consider looking weekly instead of nightly.
It fails you if: you have central or mixed apnea, where composition matters and a low total can hide a meaningful shift; you're a habitual data-checker whose mask is aging and whose baseline is drifting upward inside the safe zone; you have high or erratic leaks that make the number untrustworthy in the first place; or you're the kind of person who will read "it's just noise" as permission to ignore a three-week climb. For you, the threshold is the wrong tool, and the trend line is the right one.
There's also a group the rule quietly abandons: people whose numbers look great and who feel terrible. AHI is not sleepiness. If your machine says 1.5 and you're falling asleep at your desk, the number being good is not a reason to accept feeling bad. That mismatch is a conversation for your clinician, and no threshold on a screen resolves it.
The more honest version of the rule
If I had to rewrite the advice for the person I was on night one, it would go like this:
A single night's AHI is noise; ignore it. Check your mask leak before you trust any reading at all. Watch the two-to-three-week trend, not the threshold — a rising line inside the safe zone is worth more attention than one high night above it. And look at what the number is made of, because "4" can mean two very different things. The cutoff of 5 is a floor, not a summary. Below it you are probably well treated. But "probably well treated" and "nothing worth watching" are not the same sentence, and the standard advice tends to blur them.
None of this means becoming your own physician. It means reading the instrument the way the instrument deserves to be read — as a trend recorder with known blind spots, not an oracle that issues a nightly pass/fail. When the trend moves, when the composition shifts, when the leaks won't behave, that's the material to bring to your equipment provider or your sleep specialist. Bring them the line, not the last data point.
What I didn't answer
Plenty. This was one person, one machine, three months, and a mild-to-moderate case — I can't tell you whether any of this generalizes to severe apnea, to central-dominant apnea, or to bilevel therapy, and I'd distrust anyone who claimed a study of one could.
I never validated my device's AHI against a real sleep study, so I can only tell you how the reported number behaves, not how faithfully it tracks scored events on any given night. The gap between "machine-estimated AHI" and "lab-scored AHI" is the most important unanswered question here, and it's not one an app can close.
I also couldn't cleanly separate position from everything else, because I don't know where I actually slept. A positional tracker would fix that, and it's the next variable I'd add.
If you want to go further than I did, the place to look next is your machine's detailed data rather than its summary screen — the leak graph, the event-type breakdown, and, on many devices, the flow-limitation and pressure records that hint at whether the machine is working harder to keep your airway open before events ever show up. That layer is where the honest story lives. The top-line number is just the headline, and headlines, as ever, leave things out.