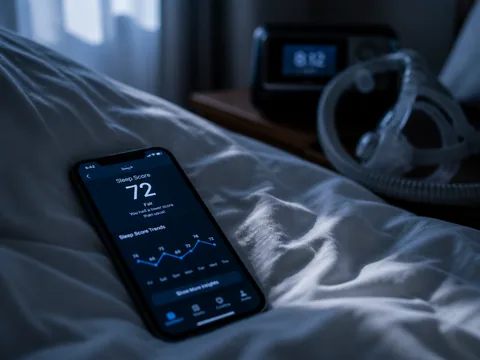
For three months I checked a number on my phone before I had checked my email. The number was my AHI — the count of breathing events my CPAP machine estimated per hour of sleep the night before. Some mornings it read 1.2 and I felt vindicated. Some mornings it read 6.8 and I spent the commute wondering whether my sleep apnea was quietly getting worse. I have moderate obstructive sleep apnea, diagnosed in a lab, treated nightly, and I had let a single figure on a glowing screen become the referee of my health.
So I ran an experiment. Ninety nights on a ResMed AirSense 11, AHI logged every morning alongside notes: alcohol, congestion, sleep position, mask reseats, bedtime. What I wanted to know was simple. Is this number telling me something, or am I reading tea leaves?
The verdict: the nightly AHI is a rough estimate that swings for reasons that have nothing to do with your disease, and its reputation for precision is far thinner than the two-decimal display suggests. The trend across weeks is worth your attention. The individual night, most of the time, is not.
Where the number I was worshipping came from
The threshold everyone quotes — an AHI under 5 is "normal," 5 to 15 is mild, 15 to 30 moderate, above 30 severe — did not descend from a mountain. It was built by committees. The Sleep Heart Health Study and a series of American Academy of Sleep Medicine scoring manuals through the 1990s and 2000s established these cutoffs from large populations of people wired up in laboratories, scored by trained technicians reading electroencephalograms, airflow, chest movement, and blood-oxygen traces.
That is the source. And the source was never designed to be consulted every morning by an individual holding a phone.
The cutoffs were epidemiological tools — good for saying "people above this line have more cardiovascular events across a population" — that got repurposed as a personal report card. A number invented to sort thousands of people once, in a controlled room, now runs on a home device that scores your airflow every night with a fraction of the instrumentation. The belief that "my AHI is 4.1, therefore I am fine" rests on a foundation built for a completely different question. The line is real. The precision we imagine behind it is borrowed.
It gets thinner still. The definition of a hypopnea — the shallow-breathing half of the AHI — has been officially revised more than once, and the versions disagree about how much oxygen desaturation counts. Depending on which rule a lab uses, the same night of sleep can produce meaningfully different scores. If trained humans using full sensor arrays can't agree on the exact number, the two decimals on my app are false confidence rendered in a clean font.
What the machine counts versus what the lab counted
My CPAP does not know when I am asleep. A sleep lab does — it reads brain waves. My machine infers events from airflow and pressure changes through the mask, and it counts across the whole time the device is running, whether I am dreaming or lying awake at 3 a.m. staring at the ceiling.
That gap matters. An hour spent awake in bed, mask on, breathing irregularly on purpose, can register events that a lab would never score because a lab would know I wasn't asleep. The device also can't reliably separate obstructive events from central ones the way a full study can, though newer units make an attempt.
None of this means the number is useless. It means the number is an estimate produced by a sensor blind to the one thing the lab measures directly — sleep itself.
The three things that actually moved my number
Ranked by how much each shifted my nightly AHI across ninety nights.
| Factor | Typical swing in my AHI | What it tells you |
|---|---|---|
| Alcohol (2+ drinks) | +2 to +5 the same night | Real physiology; muscle relaxation worsens obstruction |
| Nasal congestion / back-sleeping | +1 to +4 | Real but transient; resolves on its own |
| Mask leak & awake time | +1 to +3, unpredictable | Mostly measurement artifact, not disease |
Alcohol was the clearest signal and the least surprising. Two glasses of wine reliably pushed a 2-night into a 6-night. That is not the machine glitching; that is my throat behaving as a relaxed throat does. The physiology is sound and repeatable.
The congestion and position effects were real but short-lived. A cold pushed three consecutive nights up, then everything returned to baseline. Back-sleeping added roughly a point over side-sleeping.
The third row is the one that cured my anxiety. On nights I recorded a bad mask seal or a long stretch awake, the number jumped in ways that correlated with nothing about my disease. The 6.8 that ruined a commute turned out to be a night my mask whistled from 2 to 4 a.m. and I lay awake resenting it. The scariest single reading of the whole experiment was mostly noise.
The trend is the winner; ignore this at your peril
Here is the line worth screenshotting:
One bad night is weather. Three bad weeks is climate. Treat them completely differently.
A single high reading, surrounded by normal ones, is almost always weather — a drink, a cold, a leak, a restless night. My ninety-night average was 2.9 with individual nights ranging from 0.6 to 6.8. That spread looks alarming until you plot it: a flat trend with spikes, not a rising line.
What would actually warrant a call to your provider is a change in the baseline — a run of nights that used to sit at 2 now sitting at 8 and staying there, or a steady climb over weeks. That pattern reflects the disease or the therapy, not the sensor's bad mood. Rising leak numbers alongside rising AHI point at your mask and a worn cushion; rising AHI with clean seals points at you, and is the version worth a conversation with your sleep specialist.
Who should keep watching, and who should close the app
Keep an eye on the data if: you are newly diagnosed and still dialing in pressure and mask, you have had a recent weight or medication change, or you are trying to catch equipment wear before it costs you sleep. The weekly and monthly trend lines are genuinely useful here.
Consider closing the app more often if: you are years into stable therapy, your average sits comfortably in range, and the act of checking has become a morning ritual that generates more anxiety than information. If a 6 is going to cost you an hour of worry over what is statistically a leaky-mask night, the check is not serving you. I count myself in this group, which is exactly why I did the experiment — to earn permission to stop staring.
I could not test everything. Ninety nights is one body, one machine, one type of apnea. I never ran a lab study alongside my device to see how far the home number drifts from the scored truth, which is the comparison I most wish I had. My palate for the difference between a 2 and a 3 is, honestly, meaningless — that gap is within the noise, and I now treat it as such.
What this looks like at my bedside now
I moved the CPAP app off my phone's home screen and into a folder I open on Sundays. I write down two numbers for the week: the average and the number of nights above 5. Last Sunday that was 2.6 and one night — a night I remember, because I'd had a beer at a friend's and slept on my back on their couch. The number did exactly what the physiology predicted, and then the next night it came back down. I didn't celebrate the 2.6 or flinch at the 5.4. I noted the beer, closed the folder, and went to make coffee.