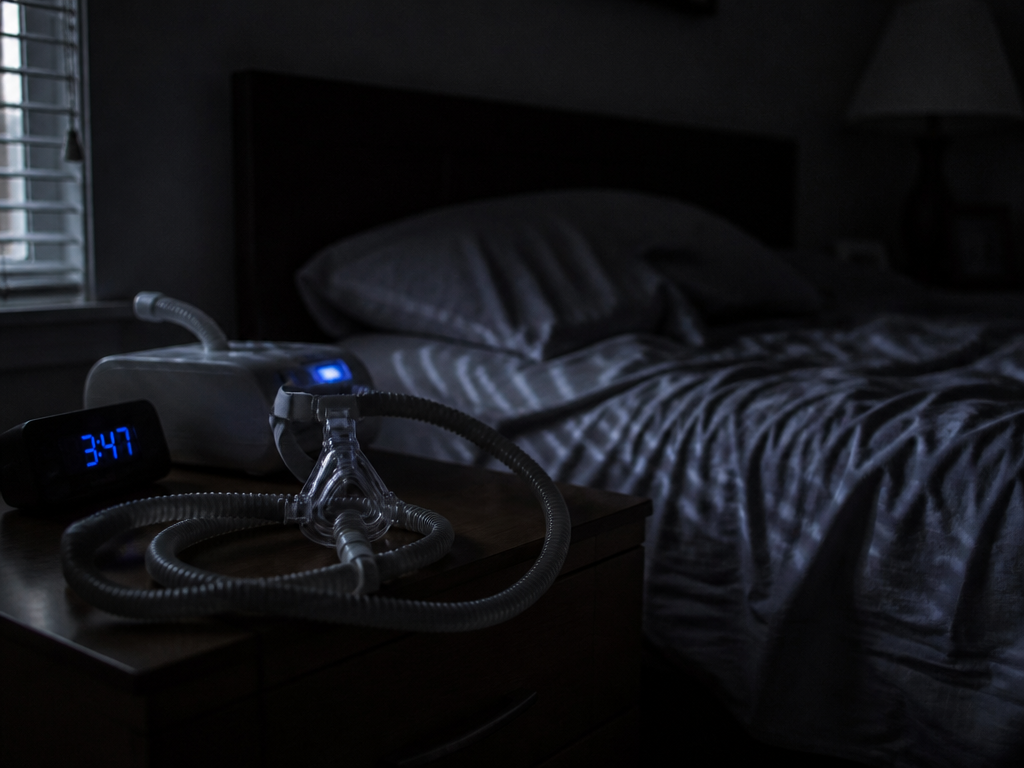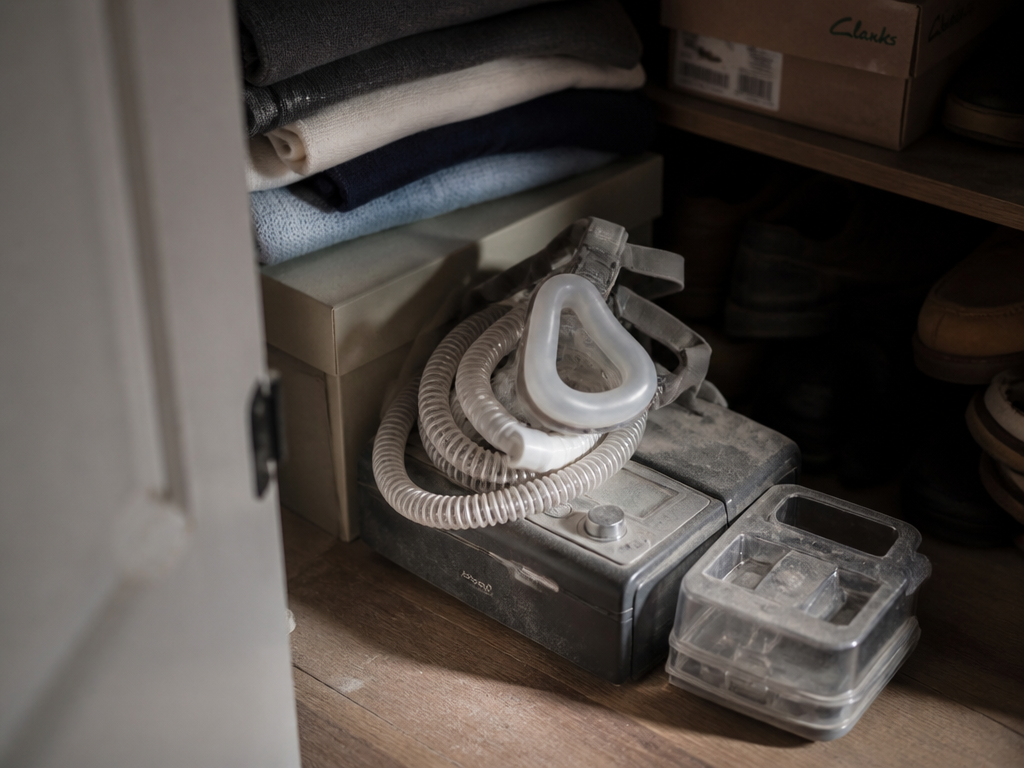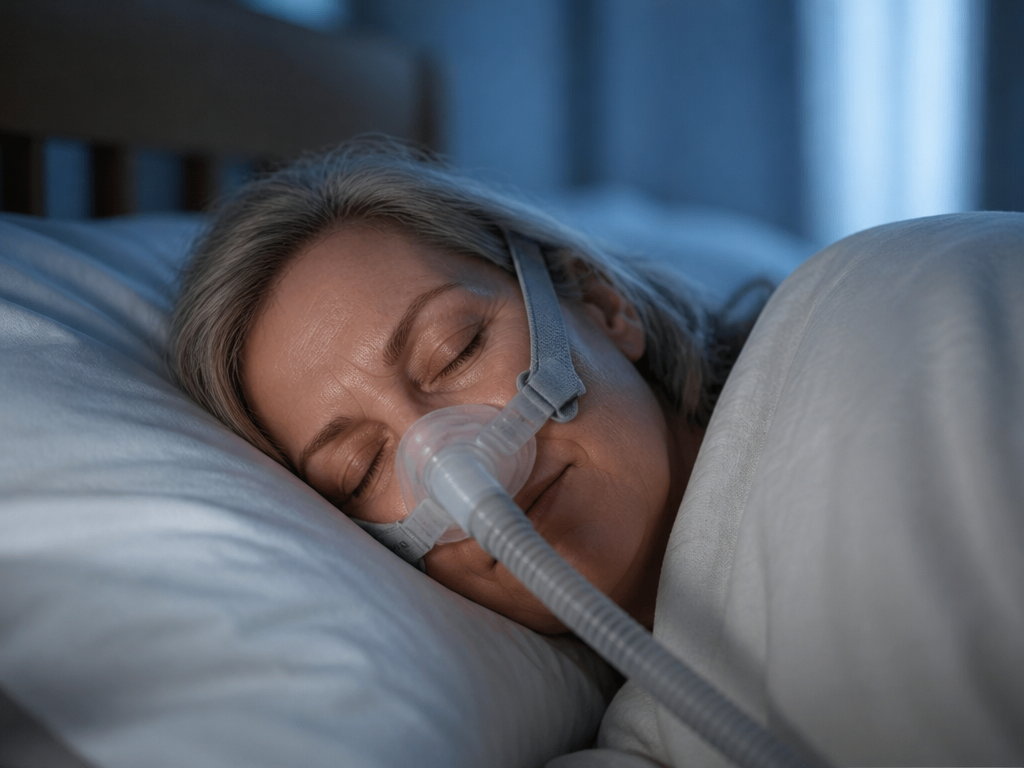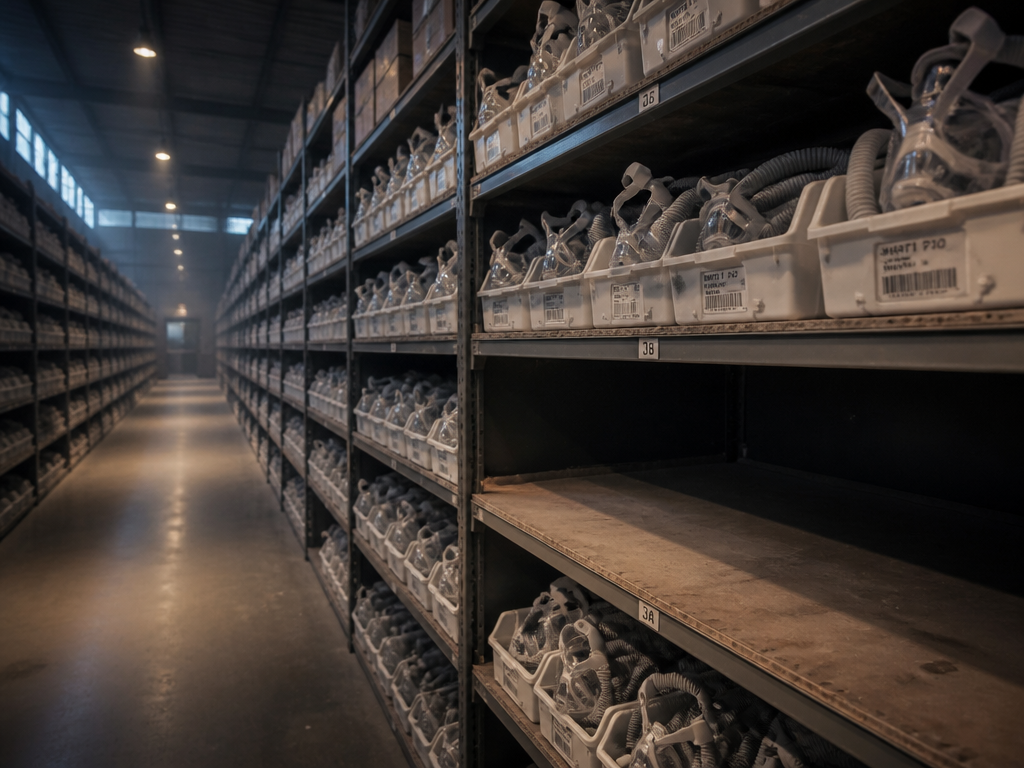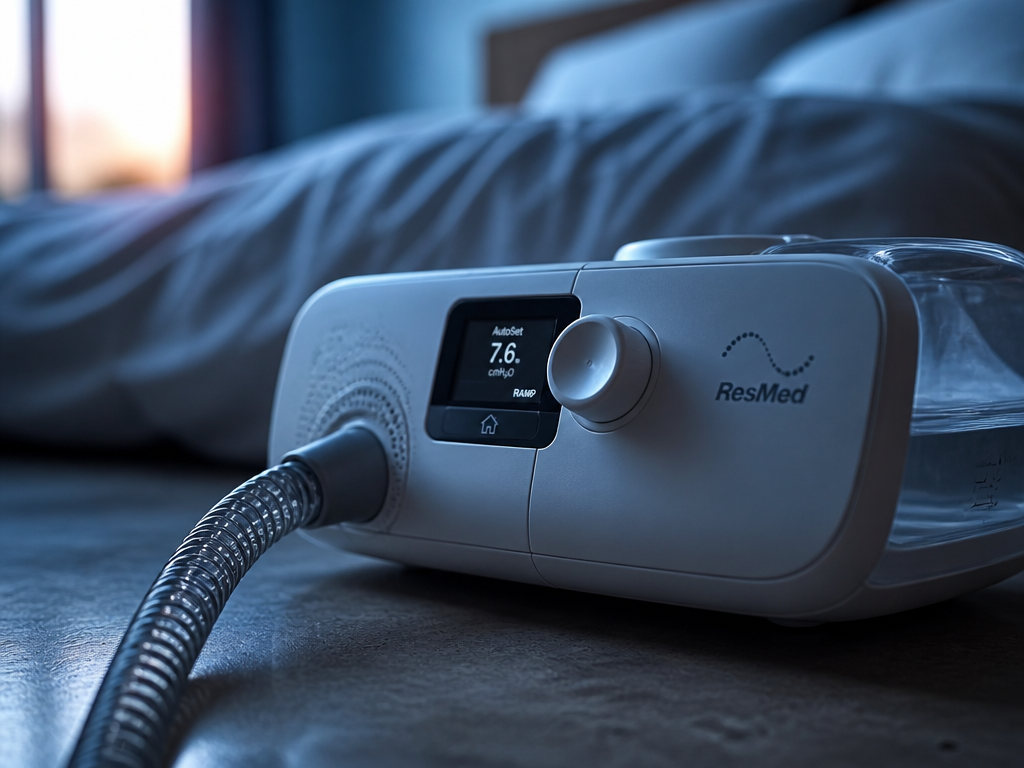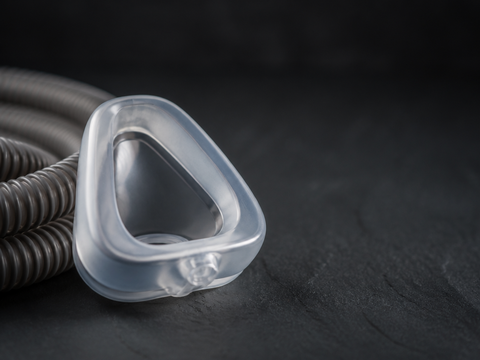
Start with the claim, then spend the rest of this earning it: the positive airway pressure business is not primarily a device business. Under half the revenue in it comes from the box on the nightstand. The fastest-compounding piece is a silicone cushion that costs less than a movie ticket and gets replaced every two weeks for the rest of the patient's life.
This matters because almost every PAP device market sizing and CAGR projections exercise you'll read — including the ones that end up in a bank's initiating-coverage deck — is built top-down from a prevalence number, multiplied by a device ASP, and grown at a rate borrowed from the previous report. That method produces a number. It does not produce an understanding of where the cash actually comes from, which unit of the business compounds, or which of the last five years of growth was real.
I want to take the standard model apart and put it back together in the order the money actually moves.
How big is the PAP device market, and how fast is it growing?
Published 2024–2025 estimates land somewhere between roughly $4 billion and $13 billion globally, growing at compound annual rates between about 6% and 11% through the early 2030s. That is a spread of more than 3x on size and nearly 2x on growth rate, and it is not because one research house is careless. It is because "the PAP market" is four different markets wearing the same name.
| What's being counted | Rough 2024 scale | What it excludes |
|---|---|---|
| PAP flow generators only (CPAP/APAP/BiPAP hardware) | ~$4–5B | Masks, resupply, humidifiers, software |
| PAP devices + masks + consumables | ~$8–10B | Diagnostics, surgical alternatives |
| "Sleep apnea devices" (adds home sleep testing, oral appliances, neurostimulation) | ~$10–14B | Drug therapy, weight-management spend |
| Sleep apnea therapeutics (adds pharma, procedures, services) | No stable consensus | — |
The figures above are bands, not precision. Treat them as a way to interrogate a report's methodology rather than as inputs to a model. The single most useful diligence question you can ask a market research vendor is: does your device number include masks? If they hesitate, the CAGR is unreliable, because mask and resupply revenue grows at a structurally different rate than hardware — it grows with the installed base, not with new patient starts. Those two curves diverge sharply once a market matures.
The second question: is this manufacturer revenue, distributor revenue, or payer allowable? A CPAP that a manufacturer books at roughly $300–400 wholesale can carry a US Medicare allowable in the $80–100-per-month range across a 13-month capped rental — call it $1,000–1,300 at the payer level, with wide state and plan variation. Both are defensible "market size" figures. They differ by roughly 3x. Reports rarely say which one they used.
The denominator everyone borrows
Nearly every top-down PAP model in circulation traces back to one paper. Benjafield et al. (2019), The Lancet Respiratory Medicine, estimated that 936 million adults aged 30–69 worldwide have mild-to-severe obstructive sleep apnea, and about 425 million have moderate-to-severe disease. It is a careful piece of work, and it is the best global estimate available.
Two things about it should slow you down.
First, the estimate is a modeled extrapolation. It projected apnea–hypopnea index distributions from a limited set of population studies onto countries with no primary sleep-cohort data at all. The authors said so plainly. The uncertainty intervals around several regional figures are enormous, and they get stripped out the moment the number enters a slide deck.
Second, several of the authors were affiliated with ResMed at the time of publication. That is not an accusation — the methodology is public and the paper has held up under scrutiny — but if the denominator of your TAM was funded by the market leader, you should note it in the model's assumptions rather than treat it as neutral epidemiology.
Then there's the companion statistic: roughly 80% of moderate-to-severe OSA is undiagnosed. This one is close to universal in investor materials and it is almost always cited without a source. The common citation is Young et al. (1997), Sleep, working from the Wisconsin Sleep Cohort — a study of middle-aged Wisconsin state employees, conducted before home sleep testing existed, before the current obesity trajectory, and before any direct-to-consumer sleep screening. The direction of the finding is almost certainly still right. The precise 80% figure is a twenty-eight-year-old regional estimate doing load-bearing work in 2026 growth models.
Here is the practical consequence. A prevalence-anchored TAM says 425 million people need therapy. The global installed base of PAP users is on the order of 20–25 million. If you read that gap as an addressable opportunity, you get a 10% CAGR for two decades. If you read it as a funnel with a hard conversion problem at every stage, you get something closer to the mid single digits with regional exceptions. Which reading you pick is the entire forecast.
How a PAP sale actually happens, in order
The funnel is where the top-down model dies, so walk it in sequence.
Suspicion. A partner complains about snoring, or a primary care physician notices resistant hypertension, or a commercial driver fails a DOT screening. This step is almost entirely unmodeled and it is the true rate limiter. Nobody self-refers for a condition whose primary symptom happens while they're unconscious.
Testing. Since the Kapur et al. (2017) AASM clinical practice guideline endorsed home sleep apnea testing for uncomplicated adults with a high pretest probability, the diagnostic step has gotten dramatically cheaper and faster. This is the strongest genuine tailwind in the category — a $150 mail-order test replacing a $1,500 in-lab polysomnogram expands throughput enormously. It is also the step most likely to be disrupted by consumer hardware; several wrist and ring wearables now carry FDA clearance for sleep apnea notification, which is not diagnosis but does feed the top of the funnel.

Prescription and setup. In the US, the patient is routed to a durable medical equipment supplier. The DME does the fitting, files the claim, and owns the customer relationship. Manufacturers largely do not. This is a structural fact that market reports underweight: in the largest market in the world, the device maker's customer is a fragmented, thin-margin distribution channel with high consolidation activity, not the person wearing the mask.
The 90-day compliance test. Medicare will not continue paying unless the patient uses the device at least four hours a night on 70% of nights during a 30-consecutive-day window inside the first 90 days. Most commercial payers mirror this. Read that again as a business model: the manufacturer ships hardware, and roughly three months later a telemetry threshold decides whether the revenue exists. Devices come back. Rentals terminate. The "unit sold" in your model is provisional.
The rental clock. In the US, PAP moves as a 13-month capped rental that converts to patient ownership. The revenue is annuitized, not booked at delivery, which means reported quarterly growth for a device maker reflects a blend of new starts, resupply, and channel inventory — three signals with three different underlying drivers, aggregated into one line.
Resupply. And then the actual business begins.
Why the therapy is inherently a consumables business
The flow generator does one thing: it delivers continuous pressurized air, typically 4–20 cm H₂O, into the upper airway. That pressure acts as a pneumatic splint, holding the pharynx open against the negative intraluminal pressure that collapses it during inspiration. It is a mechanical fix to a mechanical problem, and it is remarkably durable technology — the core pressure delivery has not changed conceptually in forty years.
But the pressure only works if the seal holds. The therapeutic component is not the blower; it's the interface between silicone and a face that moves, sweats, and rolls over. Facial oils degrade silicone. Cushions lose elasticity. A leak of a few liters per minute drops delivered pressure below the prescribed level, the airway collapses anyway, and the AHI climbs back while the patient still believes they're being treated.
So the standard replacement schedule — cushions every two weeks, mask frame every three months, tubing and filters on a similar cadence, humidifier chamber every six months — is clinically justified and happens to be one of the better recurring-revenue structures in medical devices. At ResMed, masks and accessories run somewhere around 45% of sleep and breathing hardware revenue and have generally grown faster than devices. Blended gross margin sits near 60%. That is not a hardware margin profile. That is a razor-and-blade profile with a payer footing the bill for the blades.
Which brings back the adherence problem, because resupply revenue only exists for patients still using the machine. Rotenberg et al. (2016), Journal of Otolaryngology – Head & Neck Surgery, reviewed twenty years of adherence literature and found non-adherence rates around 34%, essentially unchanged across two decades of device improvement. The older and wider-ranging estimate from Weaver and Grunstein (2008), Proceedings of the American Thoracic Society, put non-adherence anywhere from 29% to 83% depending on definition. Quieter blowers, heated humidification, auto-titration, smaller masks, phone apps — none of it moved the aggregate number much. That's an uncomfortable finding for anyone underwriting growth on the strength of product innovation, and it deserves more space in forecasts than it gets.
What the last five years did to your baseline
Any trailing CAGR computed from a 2019 or 2020 base is measuring three shocks stacked on top of each other, and you cannot separate them without a lot of work.
In June 2021, Philips recalled roughly 5.5 million Respironics sleep and respiratory devices over degrading polyester-based polyurethane sound abatement foam. In January 2024, the company entered a consent decree with the FDA that effectively halted new US sales of the affected sleep device lines pending remediation. In April 2024, Philips announced a settlement of approximately $1.1 billion covering US personal injury litigation.
The market's number two player exited the largest market in the world for several years. ResMed absorbed most of that share. If your model reads 2022–2024 growth as organic demand expansion, you have capitalized a one-time share transfer into a perpetual growth rate — which is exactly the error that makes 10%+ long-run CAGRs look defensible.
Simultaneously, semiconductor shortages capped ResMed's output through 2021–2022, creating an artificial demand backlog that released in later periods. Then DME channels, having over-ordered against shortage anxiety, destocked. Three distinct distortions, all pointing in different directions, all inside the same five-year window that most published CAGRs use as their base.
A cleaner approach: model new patient starts and installed-base resupply separately, index each to a pre-2020 base, and treat 2021–2024 as an adjustment period rather than trend. You will get a lower headline number and a far more defensible one.
Segmentation, honestly
The product-type splits that appear in every report — CPAP versus APAP versus BiPAP, with percentage shares to two decimal places — are among the least reliable figures in the category.
| Segment cut | What the share is usually derived from | How much to trust it |
|---|---|---|
| CPAP / APAP / BiPAP | US HCPCS billing codes (E0601, E0470, E0471), extrapolated globally | Moderate for the US, weak elsewhere |
| Sleep apnea vs. respiratory insufficiency indication | Prescription indication data, heavily US-weighted | Moderate |
| Home care vs. hospital/clinic | Channel shipment estimates | Weak — the codes don't cleanly distinguish |
| Regional splits (APAC, EMEA) | Modeled from prevalence and income, not measured sales | Weak |

The billing-code problem is worth understanding. E0601 covers continuous positive airway pressure; auto-titrating devices are frequently billed under it too, because the reimbursement is the same. So the "APAP share" figure in a report is often a modeled estimate sitting inside a category that doesn't distinguish the two at the point of payment. When you see APAP described as the fastest-growing segment with a share stated to a decimal place, you're looking at an inference presented as a measurement.
The geographic segmentation deserves the same skepticism, running the other direction. China, India, and Brazil are where the genuine unit-volume growth is, and they are precisely where sales data is thinnest and where local manufacturers — BMC Medical, Löwenstein, Apex — compete at price points that make Western ASP assumptions meaningless. A model that grows APAC revenue at APAC unit growth will overshoot badly.
The connected-health line item is the moat, and it's mispriced
Every PAP report has a section on connected health, and most of them frame it as a patient-engagement feature. That framing misses what the telemetry is for.
A cloud-connected PAP device generates the compliance data that determines whether the payer pays. It automates the DME's documentation burden, which is that channel's single largest operating cost. It flags mask leak, which triggers resupply. It is, functionally, revenue-cycle infrastructure with a blower attached.
That's why the software line matters more than its size suggests. ResMed's SaaS business — Brightree, MatrixCare, and adjacent out-of-hospital software — is approaching roughly $700 million in annual revenue, growing at low double digits. On its own, that's a modest software asset. As a strategic position, it means the market leader owns billing and workflow software inside the channel that decides which manufacturer's device a patient receives. The switching cost lives in the DME's back office, not in the patient's preference.
Any competitive model that scores players on device specifications — pressure range, noise in decibels, humidifier design — is scoring the wrong variables. Fisher & Paykel Healthcare, at roughly NZ$2 billion in annual revenue with homecare a substantial minority of it, has excellent mask engineering and has taken interface share. Converting that into flow-generator share is a different and much harder problem, because it runs through the channel software.
An honest rule of thumb for diligence
Before you accept any PAP forecast, run these five checks tonight:
- Split the revenue. Force new-patient hardware and installed-base resupply into separate lines with separate growth rates. If the model can't, it's a single-multiplier model wearing a spreadsheet.
- Rebase off 2019. Any CAGR anchored in 2020–2022 contains COVID, the chip shortage, and the Philips share transfer. Recompute and see what survives.
- Apply an adherence haircut. Assume roughly a third of starts don't convert to durable resupply, and ask what the forecast looks like if that number doesn't improve — because it hasn't in twenty years.
- Identify the revenue layer. Manufacturer, distributor, or payer allowable. These differ by up to 3x and reports routinely blend them.
- Discount every share figure below the national level. Sub-segment percentages are modeled from billing codes that don't distinguish the segments being reported.
A forecast that survives all five will be less exciting than the headline and considerably more bankable.
The question nobody has answered
In 2024, Malhotra et al. published the SURMOUNT-OSA results in the New England Journal of Medicine: two trials, 469 adults with obesity and moderate-to-severe obstructive sleep apnea, randomized to tirzepatide or placebo. The AHI reduction was roughly 25 to 29 events per hour on drug versus about 5 on placebo. In December 2024, the FDA approved Zepbound for moderate-to-severe OSA in adults with obesity — the first drug ever approved for the indication.
Meanwhile hypoglossal nerve stimulation has become a real business rather than a niche one; Inspire Medical Systems posted roughly $800 million in 2024 revenue, growing near 30%. Both developments were widely read as structural threats to PAP.
They might be. But the honest analysis runs both ways, and I don't think anyone yet knows which effect dominates.
The bear case is straightforward: obesity is the dominant modifiable risk factor for OSA, GLP-1 receptor agonists produce weight loss at a scale no prior intervention achieved, and a meaningful share of mild-to-moderate patients may fall below the treatment threshold entirely. Fewer patients, fewer devices, and — worse for the annuity — fewer resupply-years per patient.
The bull case is that OSA is severely underdiagnosed, and that a drug indication drags the disease into primary care for the first time. Endocrinologists and PCPs now have a reason to screen for apnea that they didn't have when the only answer was a mask referral. Every patient screened is a patient who might get tested, and a large fraction of those found will have anatomy — retrognathia, tonsillar hypertrophy, a narrow pharynx — that weight loss won't fix. In that scenario, the drug is the largest patient-identification engine the category has ever had, and PAP volumes go up.
SURMOUNT-OSA ran a year. Nobody has five-year data on what happens to AHI when weight is regained after discontinuation, and discontinuation rates for GLP-1s outside of trials are substantial. Nobody has run the trial where the endpoint is PAP prescriptions written in the two years after a drug launch. That's the study the entire forecast turns on, and it doesn't exist yet.
So the question I'd put to anyone confident about this category's next decade: if the most effective new treatment for sleep apnea is also the most effective new way to find people who have it, which of those two effects is larger — and what evidence would actually settle it?