When a neighbor-noise dispute escalates far enough to produce an arrest, the news report almost always carries a number. Eighty-two decibels. Ninety. The figure arrives as evidence and it functions as evidence — the reader now knows that something real happened at that address. What the number cannot tell you is how much sleep deprivation it caused. The scale was not built for that. It was built, in the early 1930s, to describe how loud a single tone sounds to an awake person sitting still in a quiet laboratory.
That origin still shapes nearly every noise ordinance in force today.
The scale has a source, and the source was small
Harvey Fletcher and Wilden Munson, working at Bell Telephone Laboratories, published "Loudness, Its Definition, Measurement and Calculation" in the Journal of the Acoustical Society of America in 1933. The method was simple: play a tone, play a 1,000 Hz reference, ask the listener which is louder, repeat. Out of it came the equal-loudness contours still reproduced in textbooks — curves showing that human hearing is a mediocre low-frequency instrument, and gets worse as sound gets quieter. To match a 1,000 Hz tone at conversational level, a 40 Hz tone must carry vastly more energy.
The curves are real. They are also thin in the way early psychoacoustics tends to be thin: a small group of trained observers, headphones, pure tones, one laboratory. Fletcher and Munson weren't overselling. They reported what their apparatus could measure.
The overselling came later. In 1936, the American Standards Association's specification for sound level meters turned the contours into electrical filters: A-weighting for quiet sounds, B for moderate, C for loud. B was quietly abandoned. C survives in technical corners. A-weighting — derived from a contour for quiet sound — became the default, then the law, and is now applied to jackhammers, aircraft, and amplified guitars, far outside the range it was drawn for. When the contours were re-measured for ISO 226:2003, drawing on Japanese work by Suzuki, Takeshima and others, the revised curves departed from the 1933 originals by as much as 15 dB in places at low frequencies.
So the filter inside the enforcement officer's meter is a 1936 simplification of a 1933 measurement that has since been redrawn.
What A-weighting throws away
| Frequency | Correction applied before the number is displayed |
|---|---|
| 31.5 Hz | −39 dB |
| 63 Hz | −26 dB |
| 125 Hz | −16 dB |
| 500 Hz | −3 dB |
| 1,000 Hz | 0 dB |
| 4,000 Hz | +1 dB |
The meter is not lying. It is doing what it was told: weigh sound the way a waking ear at low volume would weigh it. A bass line at 63 Hz is discounted by roughly 26 dB before the reading appears. The complaint — thumping through a shared wall, felt more than heard — is precisely the content the instrument is designed to discard. Denmark and Sweden, among others, publish separate indoor criteria in third-octave bands starting near 31.5 Hz. That is an implicit admission that the single A-weighted figure fails for the cases people complain about most.
Does noise have to wake you up to cost you sleep?
No. This is one of the better-established findings in environmental sleep research, and it dismantles the most common defense in a noise dispute — that the complainant was asleep the whole time, so no harm occurred.
What happens between the sound and the shortened night
Pressure variation reaches the eardrum, crosses the middle ear, and displaces fluid in the cochlea, where hair cells convert motion into nerve firing. During sleep, the thalamus attenuates that signal on its way to the cortex — but attenuation is not a shutoff. The auditory pathway stays partly online all night, which is presumably why we are still here.
What follows arrives in two waves. The cortex may produce a brief arousal, three to fifteen seconds, visible on EEG and usually not remembered in the morning. Alongside it — sometimes ahead of it — comes the autonomic response: heart rate accelerating over a few beats, peripheral blood vessels constricting, a small rise in blood pressure. The sleeper often returns to the same stage within seconds and reports an uneventful night. The architecture disagrees. Deep sleep is displaced, continuity broken.
Muzet (2007), Sleep Medicine Reviews, is the standard citation for the part that matters legally: the cardiovascular components habituate poorly. People who say the noise no longer bothers them still show vascular responses to it, night after night. Basner and colleagues (2006), in the Journal of the Acoustical Society of America, applied results from a polysomnographic field study of sleepers in bedrooms near airports and found awakening probability rising with maximum indoor level well below anything a person would call loud.
Where the arithmetic hides the harm
Most enforcement rests on L_Aeq — sound energy averaged across a period. The WHO's 2018 environmental noise guidelines for Europe recommend a night level (L_night) below 40 dB for road traffic, and that figure is likewise an average. Averages are generous to intermittent noise. A four-second thump every two minutes and a steady stream of distant traffic can produce nearly the same nightly number while doing very different things to a night's sleep. Basner and McGuire's 2018 systematic review in the International Journal of Environmental Research and Public Health, prepared for those guidelines, is explicit that the number of noise events carries weight of its own.
Then there is the practical failure. Complaint-driven measurement is a snapshot, taken by an official standing in the wrong room at a convenient hour, on a night the source may have noticed the visit.
An honest rule of thumb
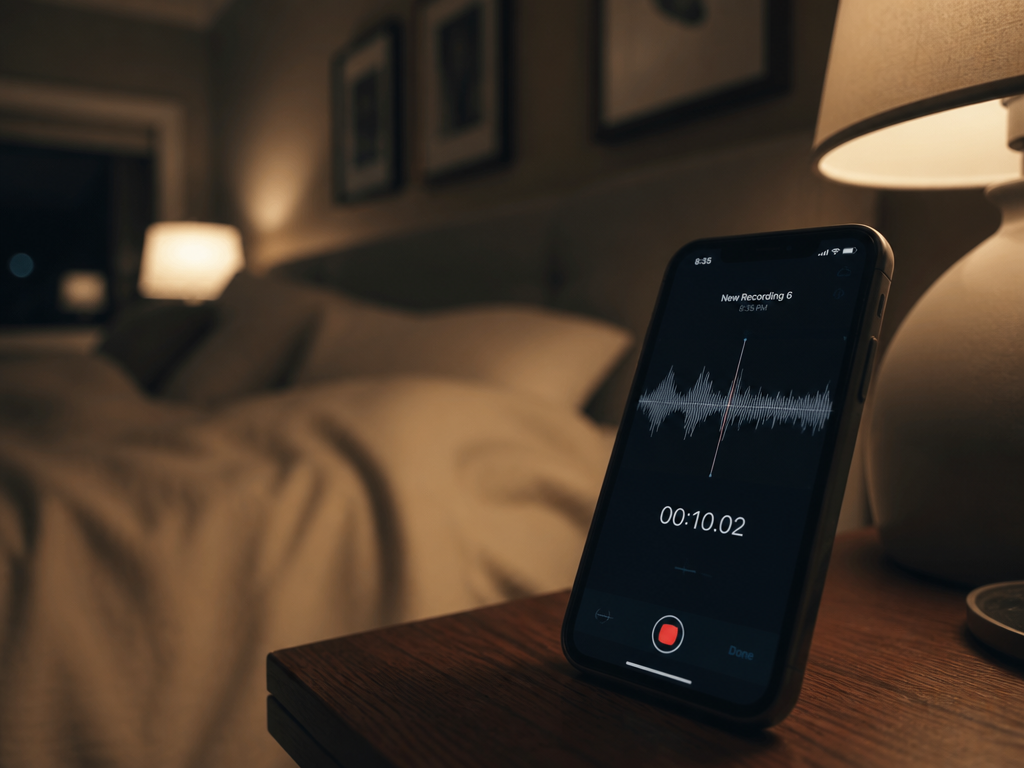
If you are the one not sleeping: stop trying to prove loudness and start proving pattern. Log start and stop times to the minute, every night, for two weeks — a plain text file is enough. Record sixty seconds with a visible timestamp when it happens. And write down whether you can hear pitch or only feel a thump, because that one distinction tells an acoustician to examine low-frequency bands instead of the A-weighted total. When someone finally comes to measure, ask them to measure inside the bedroom, with the windows as you actually keep them.
For anyone headed to a hearing: acousticians often compare the C-weighted and A-weighted readings of the same sound. A gap much beyond 15 to 20 dB indicates the energy is sitting low, where A-weighting cannot see it. This is a working heuristic, not a legal standard, but it is a defensible one.
What this doesn't settle
Almost every quantitative figure above comes from transportation noise, because that is what aviation authorities and transport ministries fund. There is no comparable polysomnographic literature on the man upstairs — no dose-response curve for intermittent amplified music through a party wall, which is the exposure that generates the arrests. Nor does the evidence separate how much of the reported illness in a multi-year dispute is acoustic and how much is the vigilance of lying awake waiting for the sound to start. Both are real; only one is measurable with a meter.
Where to look next: ISO 226 and IEC 61672 for what the instrument actually does to a signal; the WHO 2018 guidelines and the Basner and McGuire review for the sleep evidence and its limits; and the low-frequency indoor guidance published by Denmark, Sweden, and the Netherlands for what regulators do once they concede the single number has failed.
A quiet reading and a sleepless night are not a contradiction — they are two different measurements, and only one of them is currently admissible.